Most macromolecular crystallographers coming to CHESS collect diffraction data using the oscillation method - time-tested and well understood technique. Several factors must be considered to collect good oscillation data in the most efficient way possible, so as to make best use of one's limited synchrotron time.
General data collection strategy
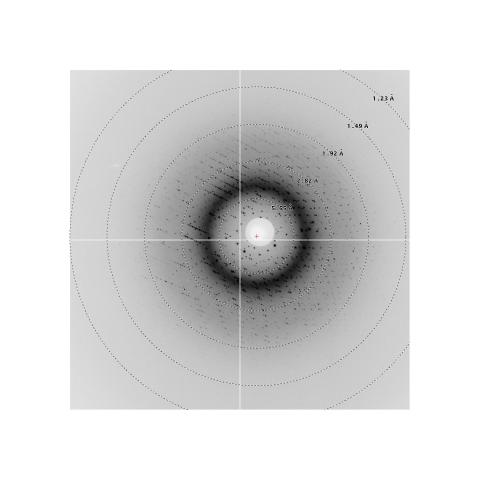
Summary of taking data efficiently:
- mount a crystal and take initial shot(s);
- check for crystal problems, good exposure time, good spot separation;
- index image, check mosaicity and oscillation range;
- check potential completeness of data;
- set experimental parameters and take data;
- process data as soon as you can - plans are nice but the proof of the pudding is in the eating!
Evaluating the Initial Image
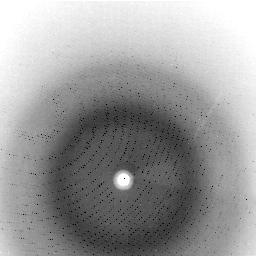
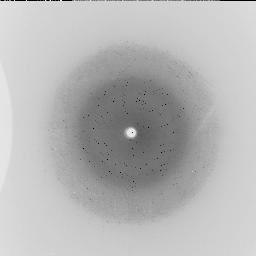
The first step in data collection is always to mount a crystal and take a diffraction pattern. Often a still exposure is taken first, followed by an oscillation if the still looks promising. What can we conclude from the image shown in Figure 1? How about Figure 2?
From the image alone several things can be checked:
- Singleness of crystal: anything other than a single pattern of well-defined lunes probably indicates a split, multiple, or twinned crystal. Translating the crystal along the spindle may allow finding a region which is single.
- Mosaicity: more spots than expected for the oscillation range are produced if the mosaic spread of the crystal is high. From the image itself one can get some feel for mosaicity, but this should be checked after indexing it (see below).
- Shadowing: it is possible for equipment such as a cooling nozzle to block part of the detector surface. This is usually obvious, but not always. In the case of a short exposure with relatively few spots (from a small molecule crystal, for example), one may need to look closely to detect the region where data are missing.
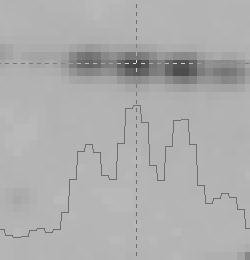
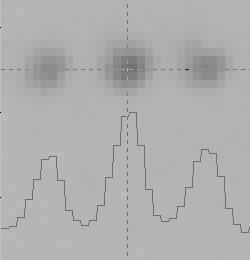
- Spot separation: successful integration of reflections requires enough separation between them. Each panel of Figure 3 shows a small region of a diffraction pattern, containing a row of spots. A plot of pixel values along the horizontal dashed line is superimposed on each display. The required distance between spots depends on the spot size, but is typically about 10 pixels, as in the example of Figure 3a. The 6-pixel separation in Figure 3b. will clearly cause difficulty in integration and should be avoided if possible, either by moving the detector back or by narrowing the oscillation range.
- Signal-to-noise: adequate peak to background ratio is needed for good data. Scaling by the image display program may make an image look fine when in fact it is not. A check of the background values may reveal the problem; backgrounds over about 1000 for image plates or 5000 for CCD's are suspicious. A program is being developed to give plots of background and signal-to-noise as a function of resolution, to aid in this aspect of image evaluation.
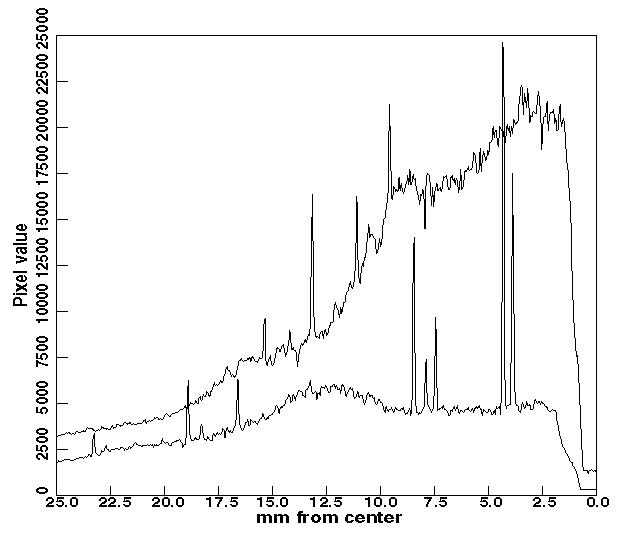
For the two images shown (Figure1 and Figure2), both crystals appear to be single. Although not shown in these figures, neither had excessive overloads in the resolution range of interest. A shadowed region is visible in Figure 2, but only a small fraction of the data will be obscured by it. The spot separation is close but adequate in Figure 1. Figure 4, however, reveals a problem. Here is plotted the background (and a few peaks) along a radius for the Figure 1 (lower trace) and Figure 2 (upper trace) images. The background in Figure 2 is clearly excessive, and will result in poor signal-to-noise for the data from this image. This high background is probably due to scattering from frozen solvent, either in or surrounding the crystal. It would be advisable to look for a better crystal, or to try mounting in a smaller loop if external solvent is the problem.
Indexing the Initial Image
Once a visually satisfactory image has been obtained, the crystal should be rotated, usually by 90 degrees, and another exposure taken, to check for anisotropic mosaicity, splitting that was not apparent on the first image, and any crystal centering problem. The latter is probable when diffraction is very weak or absent at the second spindle position but is fine on a repeat of the first exposure.
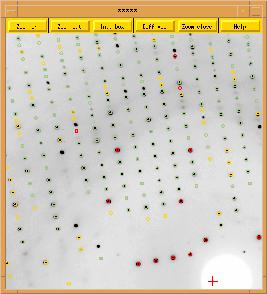
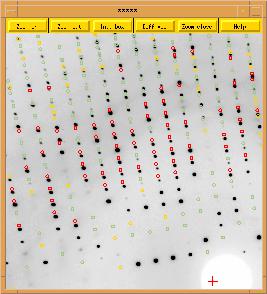
If the second image is good, it is time to index an image. This is easily done using, for example, HKL-2000 or Denzo (part of the HKL program package, by Z. Otwinowski and W. Minor); the only parameters needed are the direct beam position and the crystal-to-detector distance. A successful indexing produces the result shown in Figure 5a. The predicted reflections, shown as green, yellow, and red circles, fall on or almost on the actual spots, and very few spots have no corresponding predictions. The predictions in Figure 5b were produced when an incorrect crystal-to-detector distance was supplied. This is the most common cause of a bad indexing. A distance error makes all the calculated cell dimensions too high or too low; if the correct values are known it is easy to adjust the distance until the calculated values are reasonable. If the distance and direct beam position are correct, and the image has at least a few dozen good spots, the indexing should succeed. If not, the crystal may be twinned, so that the spots are not from a single lattice.
Figures 5a and 5b, showing portions of a diffraction image (in shades of gray) with predicted reflection positions superimposed (colored circles: green for fully recorded reflections, yellow for partials, red for "problem" reflections). Display from the HKL package.
The appropriate oscillation range may be determined by making predictions for various ranges and checking for overlapping reflections. Using a mosaicity a little on the high side for safety, a range that is as wide as possible without generating more than a few overlaps may be selected. In some cases a narrower range than this may be desired, for the reason of reducing background. A few more test exposures may be needed to settle the question. If the unit cell dimensions are not all quite similar, predictions should be made for several spindle settings, as different oscillation ranges may be appropriate at different crystal orientations.
Completeness of Data Set
The ideal data set is 100% complete, with most reflections measured several times. Naturally, this is not always possible. From an indexed image, however, it may be determined how much of the unique data can be collected on the crystal, and what range of spindle angles must be covered to get this fraction.
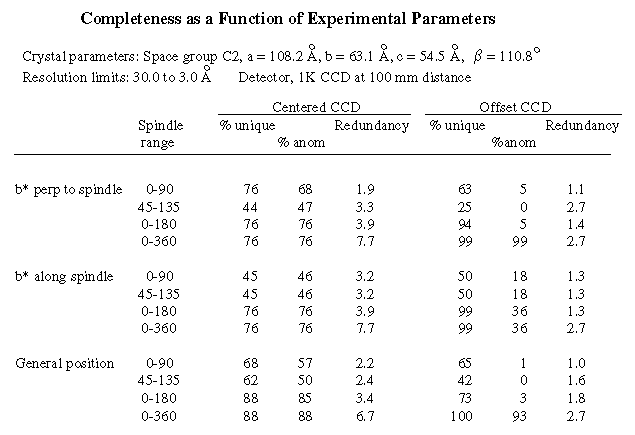
The fraction of reciprocal space that must be covered to collect all the unique data to a given resolution depends on the crystal symmetry and on whether anomalous data are required. It is common to say that because a crystal is monoclinic, one must collect 180 degrees of data, or because it is tetragonal one only needs 45 degrees. In fact, the rotation range needed to collect the unique data depends on the orientation of the rotation axis relative to the unit cell axes, i.e. on the orientation of the crystal on the camera. In the real world, an additional factor is introduced by the limited area of the detector. For the CCD detectors in particular, recording resolved spots to high resolution may require offsetting the detector perpendicular to the x-ray beam. This results in some combination of a loss of redundancy and a loss of unique data for a given rotation range. The table below illustrates the effects of varying crystal orientation and detector position. This is a case where some data are off the edge of the detector if it is not offset, so that with the CCD centered even a 180 degree rotation of the crystal only gives about 90% of the unique data at best. If the crystal is aligned with c* along the spindle, only 90 degrees of rotation are needed to give the maximum completeness, but this maximum is only 76%. If the detector is offset, a complete data set may be obtained, but it requires taking a full 360 degrees of data if anomalous data are needed or if the crystal orientation is not optimum.
In this table, the three crystal orientations shown are: 1) c* along the spindle axis, x-ray beam along b* at spindle angle 0 (Denzo crystal rotation angles rotx = roty = rotz = 0); 2) b* along the spindle axis, x-ray beam along c* at spindle angle 0 (Denzo crystal rotation angles rotx = rotz = 0, roty = 90); 3) a general orientation, Denzo crystal rotation angles rotx = 10, roty = 30, rotz = 20. "% unique" gives the percentage of the unique reflections, ignoring anomalous dispersion, that could be recorded from the crystal by rotating it over the given range of spindle angles. "% anom" gives the percentage of anomalous pairs (Bijvoet mates) that would be recorded during the same rotation. "Redundancy" gives the average number of symmetry-related observations of each unique reflection that would be recorded, assuming that anomalous data are not needed. The redundancy of anomalous measurements (not shown) would be lower. These percentages take no account of losses due to overloaded or overlapping reflections. Data for table from m.simulate program.
Crystal Orientation
Orienting a crystal with a symmetry axis along the x-ray beam can serve to minimize the rotation range required to collect a nearly complete data set. Alternatively, measurement of anomalous data may be facilitated by orienting the crystal to put Bijvoet pairs on each image. In the case of a unit cell with one long axis, placing that axis along the spindle allows wider oscillations to be taken than otherwise. The advantages of using an oriented crystal must be considered in light of the difficulty in scaling frames from a rotation series on such a crystal together, particularly in the lower symmetry classes. A data set from a second, differently oriented, crystal will probably resolve this problem.
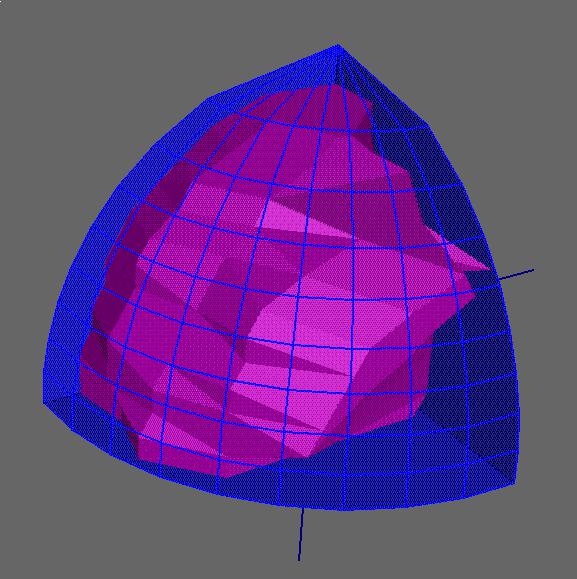
An additional consideration is that, for some symmetries, data collected by rotation about a symmetry axis will be incomplete no matter how many degrees of rotation are taken, due to the "missing cone" problem. Limitations in detector area may also become more important for oriented crystals. Figure 6, drawn by the program Geomview (from The Geometry Center at the University of Minnesota), shows the fraction of unique reflections collected in a 360 degree rotation of a small molecule crystal. The figure represents a portion of reciprocal space: the blue surface encloses the total unique volume (to the limiting resolution of the crystal) for this orthorhombic cell; the magenta surface encloses the points corresponding to the unique reflections which were actually measured. Along the left-hand edge, the magenta surface is just inside the blue, showing complete coverage, but at the lower right a substantial number of the unique reflections were not collected. The crystal was oriented with b* near, but not on, the spindle axis; the CCD detector was offset, in order to get the desired resolution. The missing regions are due to a combination of limited detector size, "missing cone" effect, and a cooling nozzle shadow that was not obvious during data collection (due to the small number of spots per image).
Although this image was generated using the reflections actually collected, the missing regions due to crystal orientation and detector geometry could have been predicted ahead of time using m.simulate, and the desirability of taking more data on a second, differently oriented, crystal would have been clear. In future, users will be able to check the potential completeness of their data before taking it. An additional capability planned for m.simulate is that of reading in an earlier data set and telling whether the current crystal will fill in gaps or merely replicate earlier data.
At CHESS, considerations of desirable crystal orientations are currently moot, as reorienting of crystals is limited to what can be done on the goniometer arcs. This may change in the future, however, and it is sometimes possible to influence a crystal's orientation during the mounting process.
To optimize the anomalous signal from a crystal not oriented with a mirror plane perpendicular to the spindle, it may be desirable to use the "inverse beam" approach: after a few degrees of data have been taken the crystal is rotated 180 degrees and the same amount of data collected. The second set of images will contain the anomalous mates of reflections on the first set. Note that this will only be true for all reflections if the detector is centered.
Preparing to Take Data
Enough information is now available to determine the experimental parameters for data collection. These are:
- Exposure time: set to give few overloads in the resolution range of interest and a reasonably low background. Multiple passes with different exposure times may be necessary to get a wide resolution range. The minimum exposure time per degree is set by the maximum speed of the spindle motor. For strongly diffracting crystals, it may be necessary to attenuate the x-ray beam to avoid overloading.
- Oscillation range: set to minimize number of exposures, while allowing few overlapping reflections and keeping background low. May vary with spindle setting.
- Detector distance and offset: set to avoid having spots too close, while collecting data as close to the limiting resolution of the crystal as possible.
- Limits of total oscillation: set by range needed to get the most complete data set possible for crystal's orientation. More than the minimum range may be taken if high redundancy is wanted.
- Crystal orientation: set, if desired and possible, to minimize number of exposures or maximize quality of anomalous data. Except for rotation about the spindle, can only be controlled (at CHESS, now) to a limited degree, and would usually not be changed.